Live Demo:3D Donut Chart
Problem: Need to visualize data in animated chart on webpage.
Situation: This is just to showcase the awesome JavaScript library of D3 (Data-Driven Documents) .
App Flow: We have some HTML container divs. During Page Load the JavaScript object "winOsObj" (line 90) is defined and immediately executed. winOsObj fetches the data from a SharePoint list (DevList03) then does some data manipulation, finally it draws the 3D Donut chart using D3's draw function (line 157).
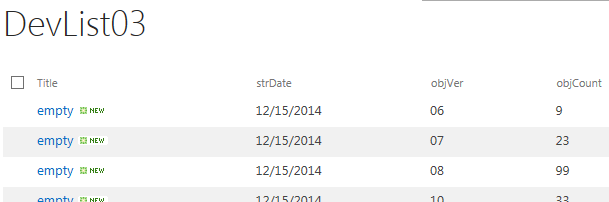
Data store: SharePoint list ("DevList03"):
HTML/JS code:index.html